
Using the Standard Deviation to analyze the exam scores, the following was observed:
1. Mean (Average) = 51
This means that if you add up all the scores and divide by the number of students, you get 51. It's
a measure of the overall average performance.
2. Median = 53
The median is the middle score when all scores are arranged in order. So, half of the students
scored below 53 and half scored above 53. This suggests that the scores are not heavily skewed, as
the median is close to the mean.
3. Mode = 53 and 33 (Bimodal)
There are two most frequent scores — 53 and 33 — meaning a lot of students scored 53, and many
others scored 33. This indicates a bimodal distribution, which usually points to:
● Two distinct groups of students — possibly high performers and low performers.
● Some students may have struggled significantly (scoring 33), while others did well (scoring 53).
Interpretation of All Together:
● Median > Mean: This suggests a slightly left-skewed distribution, where some low scores (like
33) are pulling the mean down.
● Modes at 53 and 33: Confirms the presence of two peaks in the data — one group
scoring high (53), and another low (33).
● Implication: The class may have a performance gap — perhaps due to differences in preparedness,
teaching effectiveness, or external factors affecting part of the group.
Conclusion:
The scores show two clusters of students — some doing well, some poorly. The average is brought
down by low scores, even though most students scored 53 or 33. This pattern may call for targeted
intervention for struggling students while maintaining support for those doing well.
Analysis
Final Exam
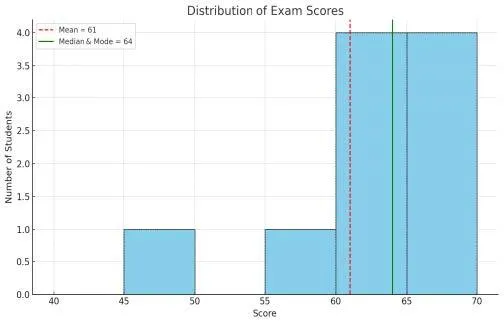
Here is a histogram showing how the exam scores are distributed:
● The green line at 64 marks both the mode and the median, showing that most students scored around this value.
● The red dashed line at 61 shows the mean, which is slightly lower due to a few lower scores
● (like 45 and 55).
This visual reinforces that the data is negatively skewed, likely due to a small number of students with much lower scores than the rest.
Implication for Teachers:
● Most students are performing fairly well.
● But there may be a small group of students struggling significantly and pulling the average down.
● These students may need remedial support or targeted intervention.

Final Exam Analysis
Using the Standard Deviation to analyze the exam scores, the following was observed:
● Mean = 61
● Median = 64
● Mode = 64
1. Mode = 64
The mode is the most frequently occurring score. This means that 64 is the most common score among
the students.
2. Median = 64
The median is the middle score when all the scores are arranged in order. So, half the students
scored 64 or lower, and half scored 64 or higher.
3. Mean = 61
The mean (average) is lower than the median, which indicates that some lower exam scores pulled the
average down.
Conclusion: Negative Skew
● This is a case of a negatively skewed distribution (or left-skewed).
● Most students scored around 64.
● However, a few students scored much lower than the rest, which pulled the mean down to 61.
Visual Example (simplified):
Scores might look like this:
45, 60, 64, 64, 64, 65, 70
● Mean: slightly lower due to 45
● Median: 64 (middle value)
● Mode: 64 (most frequent)

Contact
© Copyright 2025. All rights reserved.